📉 How-tos survival 🧐
Watching “ReactJS Basics” course the other day I’ve noticed that the further I go – the smaller number of pageviews for each lesson was. But is that “dropout rate” the same for all courses? Here is my little research.
Intro
So the procedure we are going to follow is called survival analysis. It’s very well known in medicine but could be applied to many more industries as well.
The fraction of patients living for a certain amount of time after treatment. by Wikipedia
Let’s think of a brighter example for it than cancer patients. It could be a percentage of working laptops from the same batch or fraction of people who continue using your product after the first week, second week, etc.
In our research, we’ll look at how many people who started online course continue with it and watch new lessons.
Main assumption
We are going to work with Youtube data since it’s open and there are plenty of interesting courses. But there is a very important assumption – to make a precise survival analysis we’d need to know timestamp and user id for every view of every video in the course. But since Youtube gives us only a number of pageviews per video, let’s assume that all pageviews are unique and there are no users who started the course lately (we’d exclude them in real analysis).
Getting the data
So I’ve picked up some courses on programming, chess, guitar, drawing, and fitness:
- Learn to Draw
- Beginner Guitar Lessons
- How to Play Chess
- 21-Day Summer Shape-Up Challenge
- Machine Learning with Python
- ReactJS + Redux Basics
- React JS Tutorials for Beginners
I think there is no use to share Ruby basics like looping through an array of ids and dump downloaded data to CSV, you can check all the code yourself. May be pay attention how it’s organized. It’s very much inspired by Jupyter Notebooks in Python: progression of steps that should be run one by one.
Visualize survival curves
At this point, we have pageviews for each video in selected courses. Before we start processing it, let’s just plot it as it is. I think this step is very useful in any research you do.
Gnuplot is pretty much a standard, so let’s go with it:
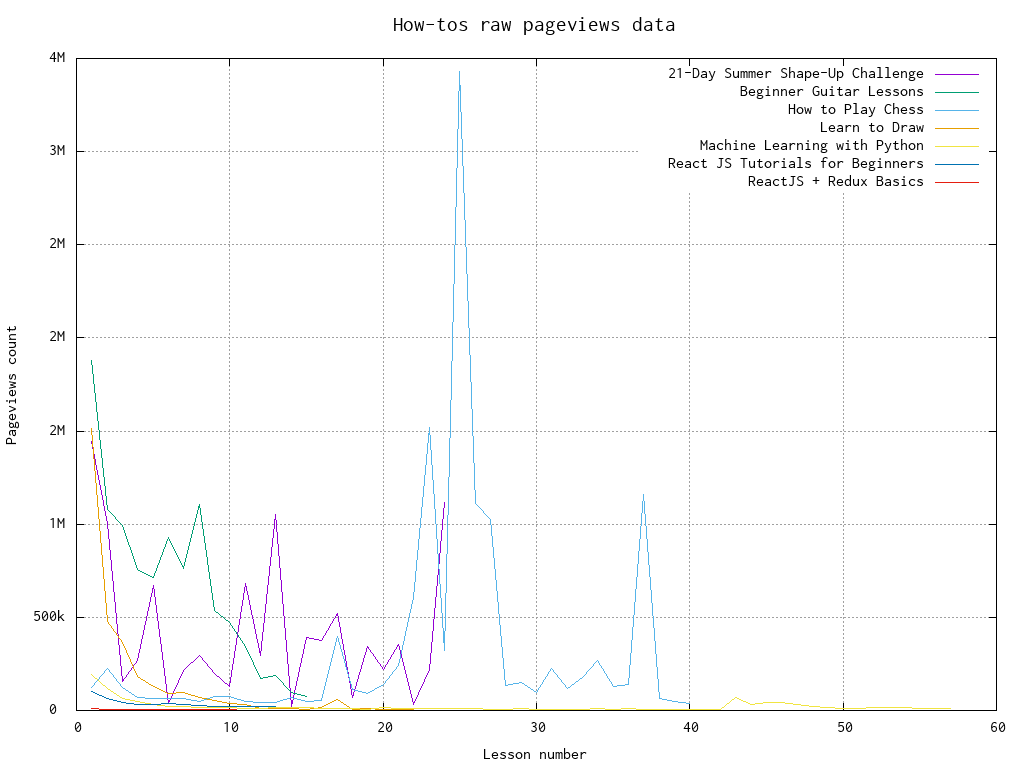
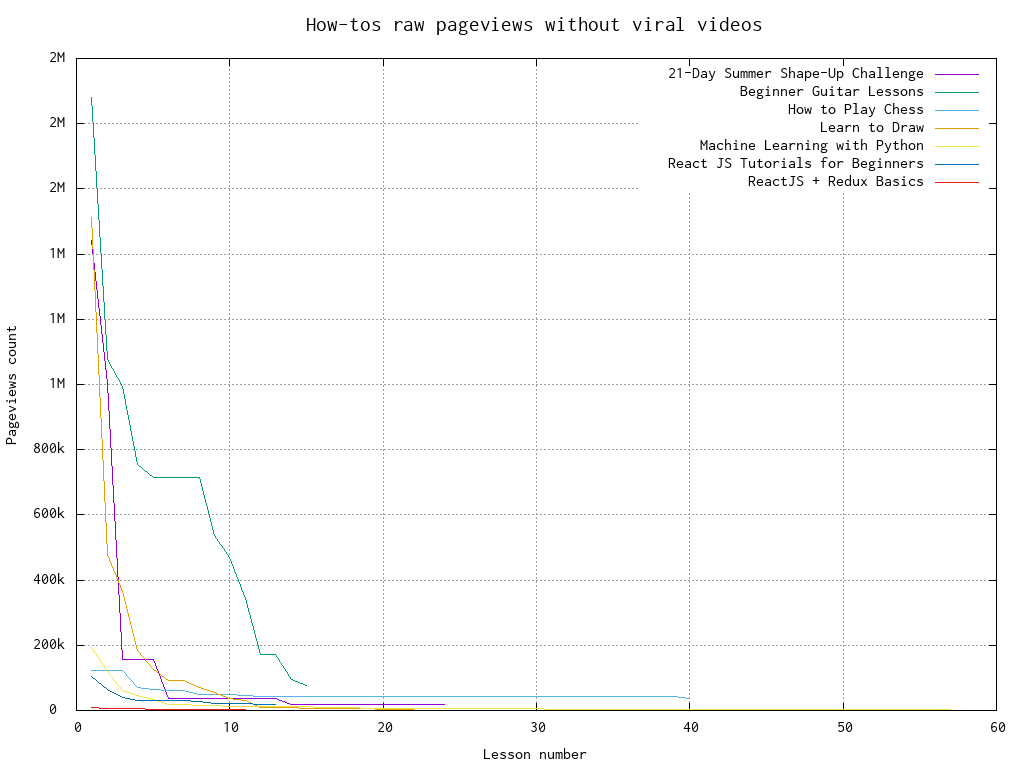
As you can see not every curve has downward slope – there are spikes in the middle with millions of pageviews. I guess it’s very specific to Youtube when some videos became viral – just look at the title “How to Achieve Checkmate in 2 Moves”. So we’ll remove these points. We’d also remove pageviews when users haven’t started from the beginning, but our assumption is that there are no such pageviews.
For the final plot we will calculate a portion of “survived” users for every lesson:
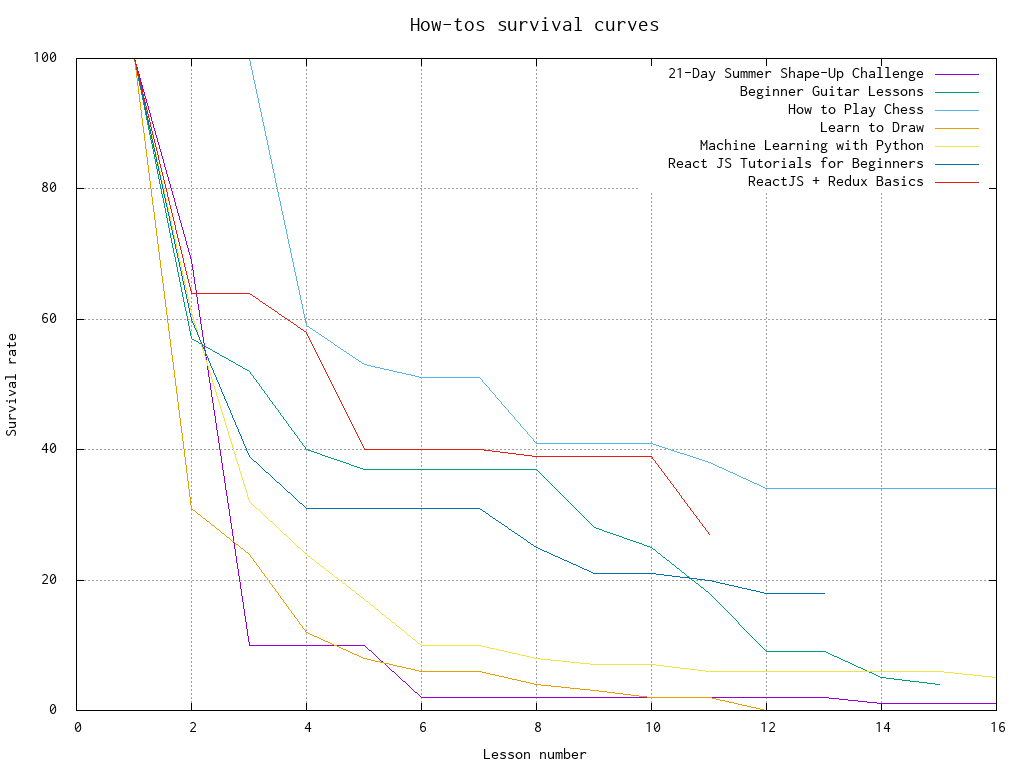
As you can see it’s really hard to survive singing and drawing classes online 😃 On top, we have chess and React JS – both are easy but bring you a lot of fun! 🍻
P.S. All code for this post is available on Github.
 SHARE ON TWITTER
