🎸 How to tune a guitar with Ruby and FFT 📊
From time to time, when nobody sees me, I like to play the guitar and every time I face a challenge – how to tune it properly. And like in any other case Ruby comes to the rescue!
Run-up
Tuned classic guitar has known frequencies – 329,63Hz for the open first string and so on. So to tune the guitar we need to know frequency shift for any string and simply fix it.
Let’s start by recording the sound of the first open string.
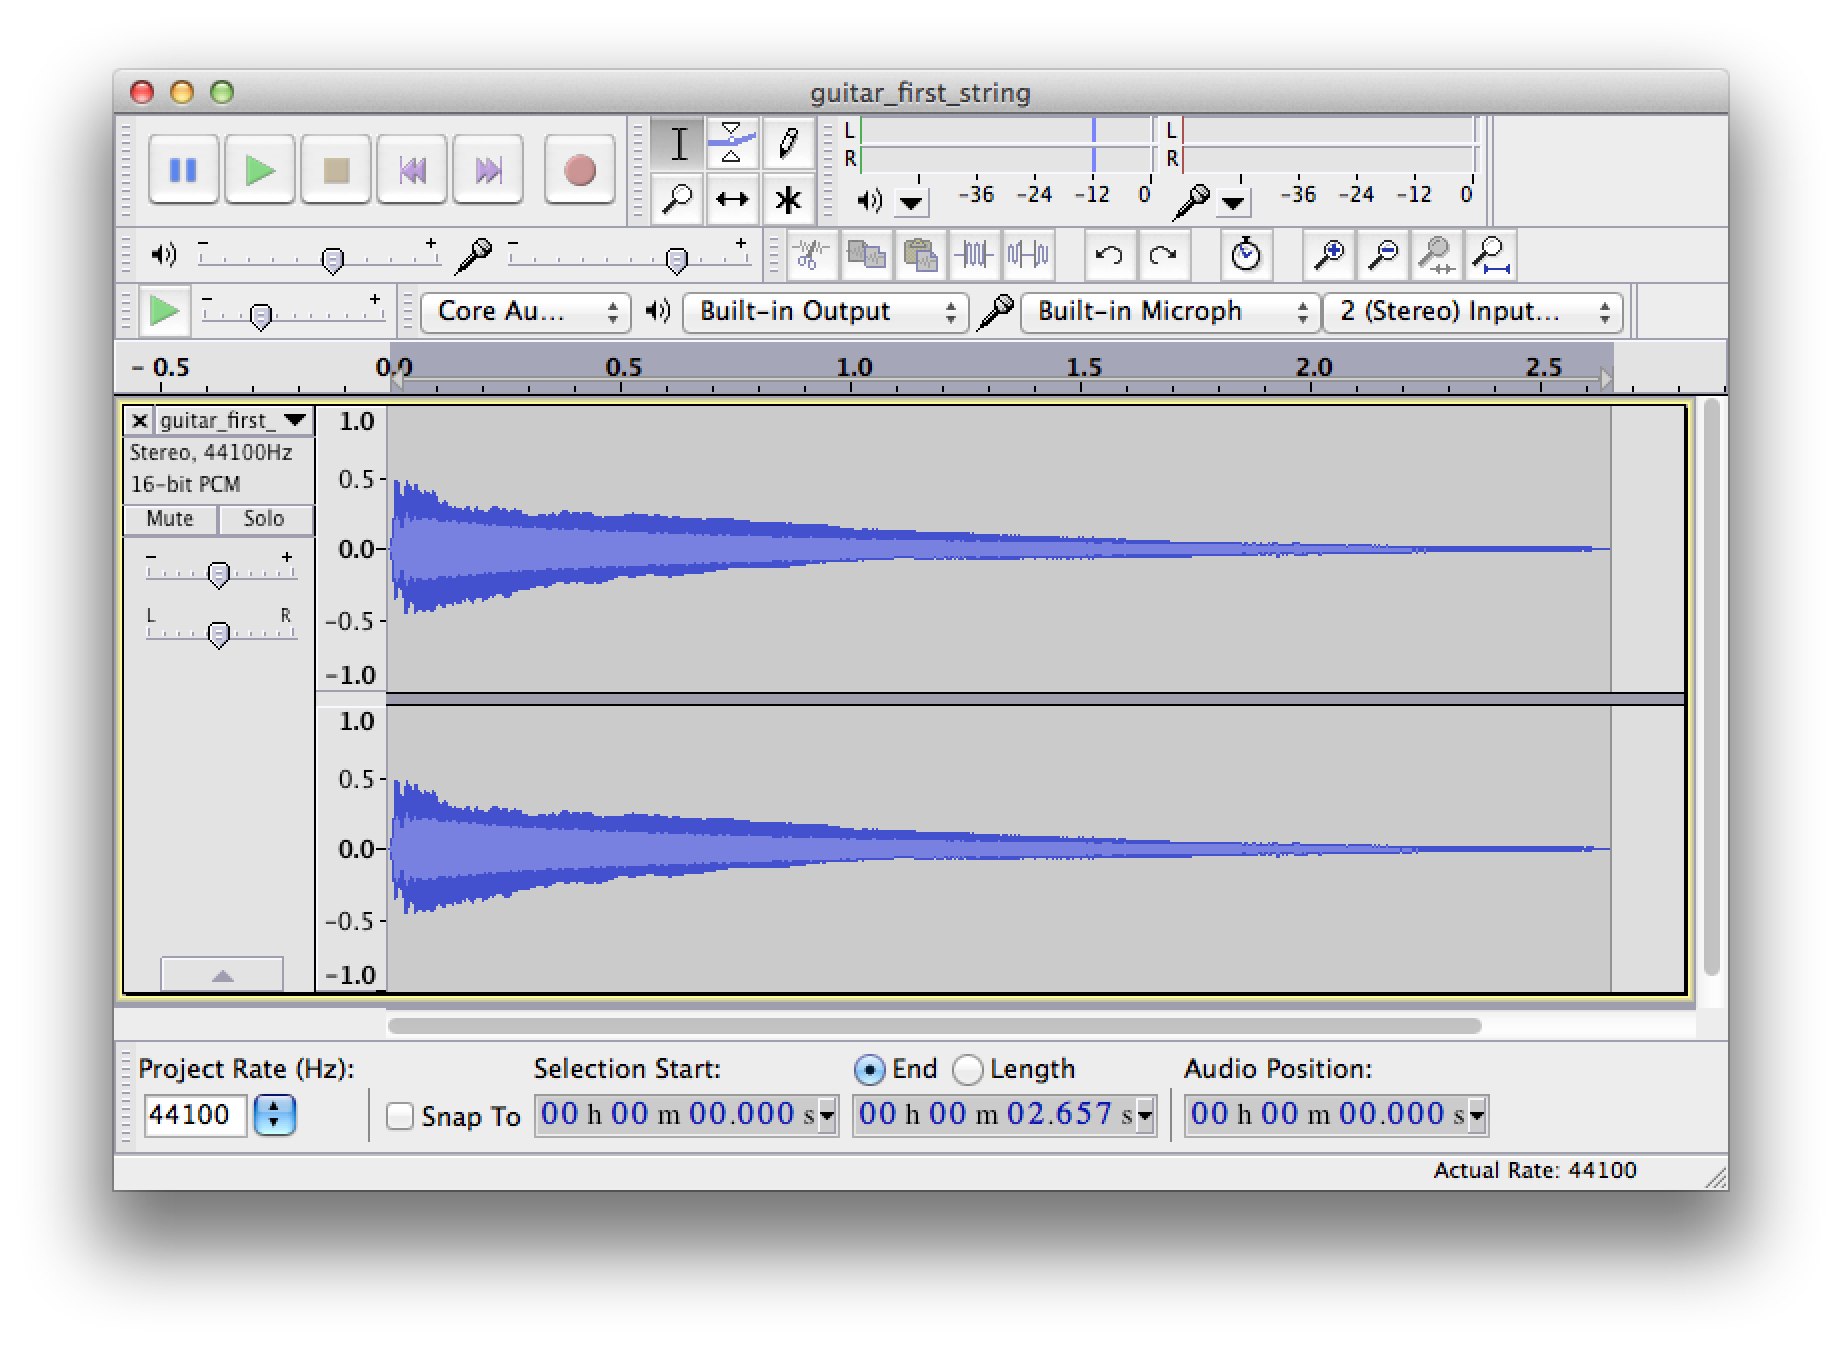
In .wav file we have “signal vs time” data and to look at the wave form we can use some software, like Audacity:
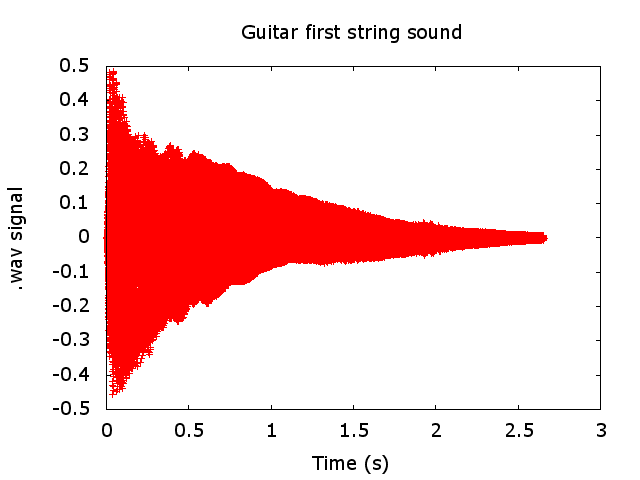
or we can plot it with Ruby and Gnuplot.
To obtain sound vs time data from .wav file let’s use SoX:
1
sox guitar_first_string.wav guitar_first_string.dat
guitar_first_string.dat will consist of several columns – time and volumes of every channel:
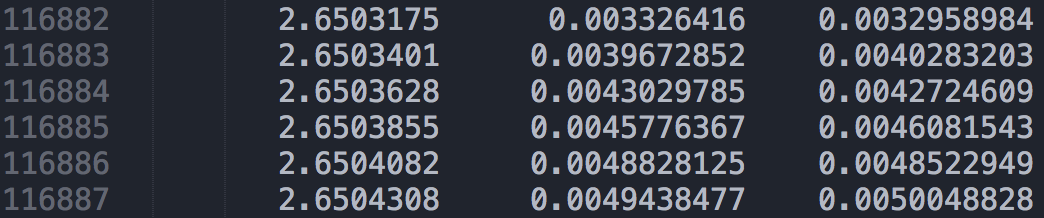
You can download .dat file from here.
Plotter code:
1
2
3
4
5
6
7
8
9
10
11
12
13
14
15
16
17
18
19
20
21
22
23
24
25
26
27
28
29
30
31
32
33
34
35
36
37
38
39
40
require 'open3'

class GNUPlotter < Struct.new(:data, :params)
  def plot
    image, s = Open3.capture2("gnuplot", stdin_data: gnuplot_commands, binmode: true)
    system "open #{params[:image_name]}"
  end

  private
  def gnuplot_commands
    commands = %{
      set terminal png font "/Library/Fonts/Arial.ttf" 14
      set title "#{params[:title]}"
      set xlabel "#{params[:x_axis_title]}"
      set ylabel "#{params[:y_axis_title]}"
      set output "#{params[:image_name]}"
      set key off
      plot "-" with points
    }

    data.each do |x, y|
      commands << "#{x} #{y}\n"
    end

    commands << "e\n"
  end
end

sound_data = File.read("guitar_first_string.dat").split("\n")[2..-1].map { |row| row.split.map(&:to_f) }.
  map { |r| r.first(2) }

plot_params = {
  image_name: "plot.png",
  title: "Guitar first string sound",
  x_axis_title: "Time, s",
  y_axis_title: ".wav signal"
}

plotter = GNUPlotter.new(sound_data, plot_params)
plotter.plot
Fast Fourier Transform
Mathematical transformation employed to transform signals between time domain and frequency domain by Wikipedia
We will use http://www.fftw.org/ library for converting .wav file data (sound vs time) to its spectrum (magnitude vs frequency).
Now we have everything to calculate spectrum.
1
2
3
4
5
6
7
8
9
10
11
12
13
14
15
16
17
18
19
20
21
22
23
24
25
26
27
28
29
30
31
32
33
34
require "fftw3"
require_relative "plotter"

def read_channel_data(filename, channel_number)
  data = File.read(filename).split("\n")[2..-1].map { |row| row.split.map(&:to_f) }
  duration = data.last[0]
  signal = data.map { |r| r[channel_number] }

  return signal, duration
end

def calculate_fft(signal, duration, max_points = 3000)
  na = NArray[signal]
  fc = FFTW3.fft(na)

  spectrum = fc.real.to_a.flatten.first(na.length / 2).first(max_points).each_with_index.map do |val, index|
    [index / duration, val.abs]
  end
end

signal, duration = read_channel_data("guitar_first_string.dat", 1)
spectrum = calculate_fft(signal, duration)

max_frequency = spectrum.sort_by(&:last).last.first.round(2)

spectrum_plot_params = {
  image_name: "spectrum.png",
  title: "First guitar string spectrum #{max_frequency}Hz",
  x_axis_title: "Frequency, Hz",
  y_axis_title: "Magnitude"
}

plotter = GNUPlotter.new(spectrum, spectrum_plot_params)
plotter.plot
And a final plot:
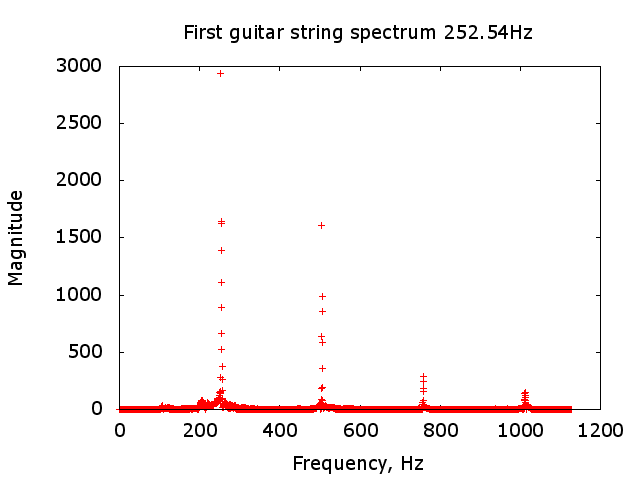
As you can see we need to pull the string for 77.09Hz :)
 SHARE ON TWITTER
